Collaborations avec l’Afrique du Sud
Les collaborations entre le CRC et les laboratoires sud-africains d’océanographie, de sciences du climat et d’écologie, basés à Cape Town, sont à l’honneur dans la Newsletter de Juin du South African Environmental Observation Network.
![]()
When El Niño and La Niña events modulate rainfall and vegetation greenness in the winter rainfall region of South Africa
Source: http://www.saeon.ac.za/enewsletter/archives/2011/june2011/doc07/
|
While anthropogenic and natural climate change and variability are much discussed, the impact of the El Niño / La Niña Southern Oscillation (ENSO/LNSO) on climate in the winter rainfall region of South Africa has only recently been discovered. This phenomenon appears to have become important for the southwestern part of South Africa’s climate only in the last few decades.
Dr Nathalie Philippon, Junior Researcher from the Climate Research Center (CRC), University of Burgundy, Dijon, France describes the phenomenon:
Whereas the impact of El Niño / La Niña Southern Oscillation on the rainfall and vegetation greenness of South Africa’s summer rainfall region is largely documented and still regularly investigated, little is known about its impact on the winter rainfall region located at the southwestern tip of the country. Yet this region holds two of the world’s biodiversity hotspots – the Fynbos and the Succulent Karoo, the second largest city of the country, and is a net exporter of high quality agricultural products (apples, table grapes, oranges, wines … cultivated under irrigated conditions mainly).
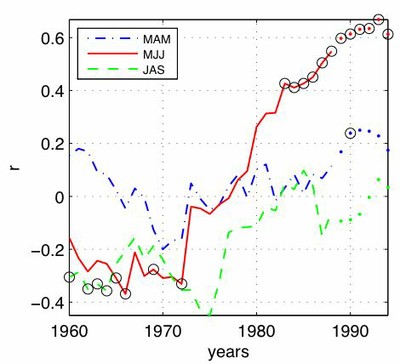
The relationship between ENSO and South Africa’s winter rainfall has been analysed using a daily rainfall database of 682 rain gauges (Lynch 1999) documenting the period 1950-1999. Figure 1 shows the 21-year moving correlations between the Niño3.4 index and the March, April, May (MAM), May, June, July (MJJ) and July, August, September (JAS) rainfall amount over the region (all rain gauges average).
The Niño3.4 index documents the sea surface temperature evolution over the equatorial Pacific (5°S-5°N/), and thus the ENSO/LNSO phenomenon. Interestingly, the MJJ seasonal rainfall amount shows a positive correlation with the Niño3.4 index that has become significant since the mid 1970’s. Such a decadal variability in the teleconnection with ENSO is not specific to the region as it is observed for the summer rainfall in Southern and Western Africa as well.
Over the period 1979-1999, about 36% of the MJJ rainfall amount variance is explained by ENSO, and when the region records ~130mm in MJJ on average, this amount drops to ~90mm during LNSO years and rises to ~170mm during ENSO years. At the rain gauge scale, most of the stations record a 10-30% increase in rainfall during ENSO years, whereas during LNSO years it is mainly the stations north of 32°S that record a decrease of rainfall of ~40%.
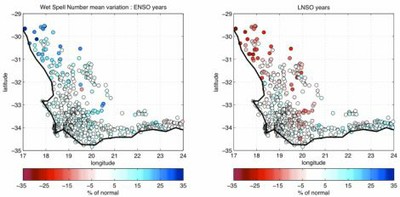
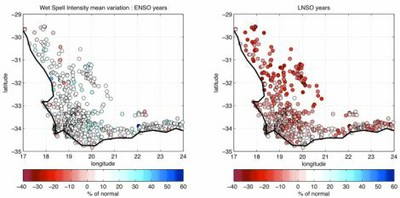
To understand where the ENSO signal in the MJJ rainfall amounts come from, changes in the wet spells properties (length, frequency and intensity) have been assessed. Figures 2 and 3 present the variation (% of the normal) in the number of wet spells and their intensity for each rain gauge during ENSO and LNSO years. High MJJ rainfall amounts recorded during ENSO years are mainly the result of more frequent wet spells, north of 32°S in particular (Figure 2), while low MJJ rainfall amounts during LNSO years can be attributed first to wet spells bringing less rainfall (Figure 3).
The atmospheric dynamics fields associated with the wet spells feature lower pressure and northwesterly wind anomalies in the troposphere over the region during ENSO years and higher pressure and southerly wind anomalies during LNSO years. This suggests that rain-bearing systems are deeper and larger in extent, and located further north during ENSO events. During LNSO event they are thinner and smaller in extent and located further south.
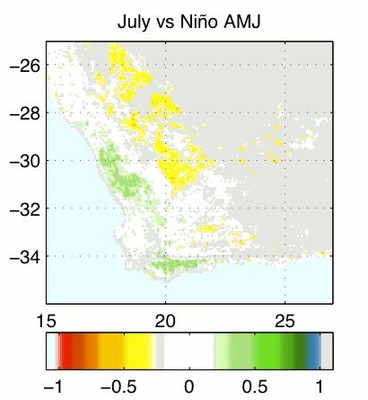
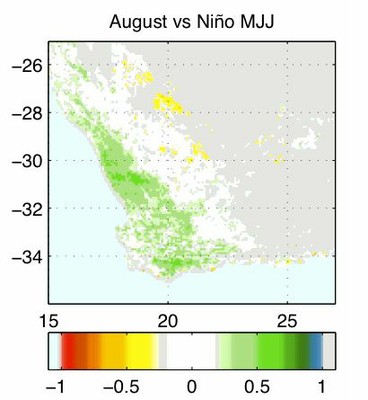
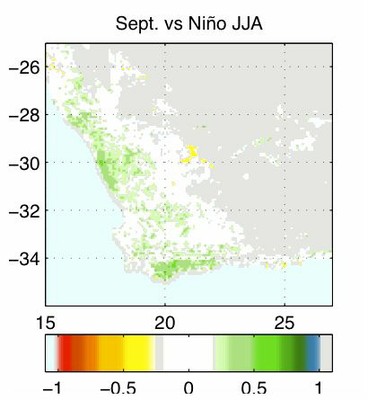
Finally, Figure 4 presents the correlation between the Niño3.4 index and the Normalized Difference Vegetation Index (NDVI) field over the period 1982-2008 for the months from July to September. NDVI is a remote sensed measure of the vegetation photosynthetic activity and greenness inferred from the reflectance differences in the red and infra-red channels. Here NDVI data come from the NOAA-AVHRR database with a 8 km spatial resolution.
Given the high sensitivity of vegetation greenness to rainfall over the region, ENSO years, which are associated with higher than normal rainfall amounts in MJJ are logically associated with a higher than normal vegetation greenness as denoted by the positive correlations. The largest ENSO signal in vegetation greenness is observed in August, the peak of the vegetative season. However it is interesting to note that the ENSO signal emerges as soon as July in the regions north of 32°S (Namaqualand) and south of 34°S (Garden Route, Overberg).
Given the good predictability of the ENSO/LNSO events several months in advance, ENSO forecasts could be a tool for the management of water resources as well as fire throughout the region. Indeed, by modulating through the rainfall, the soil moisture and fuel load we can expect ENSO/LNSO events to play to some extent on fire frequency and intensity.
 |
|
Figure 1: 21-year moving window correlations between Niño3.4 and the rainfall amount (average of the stations / grid-points) on the period 1950-2005 from Lynch (1950-1999, line) then GPCC (2000-2005, dots) database for the three trimesters MAM, MJJ and JAS. Niño3.4 and rainfall are considered synchronously. The black circles denote values significant at the 95% level according to Ebisuzaki random phase test. The x-axis provides the central year of the 21-year period.
|
 |
|
Figure 2: Mean variation (in percentage of the normal) of the number of wet spells during ENSO (left) and LNSO (right) years.
|
 |
|
Figure 3: Mean variation in the intensity of the wet spells (as a percentage of the normal) during ENSO (left) and LNSO (right) years.
|
 |
 |
 |
|
Figure 4: Correlation maps between July, August and September NDVI and the Niño3.4 index for the previous trimester. Shades of green and yellow respectively denote positive and negative connotations (enhanced greenness during ENSO years and reduced greennesss during LNSO yeards). Only the pixels in their vegetative season are considered.
|
||
|
Dr Nathalie Philippon was awarded a travel grant by the SAEON Fynbos Node to foster cooperation between Fynbos researchers and international scientists. She was nominated by Professor Timm Hoffman of the Plant Conservation Unit, University of Cape Town. Nathalie is a Junior Researcher from the Climate Research Center (CRC), University of Burgundy, Dijon, France. With a background in Geography and Climatology, her research focus is on rainfall variability and predictability in Africa. Awarded 1st prize by the French National Committee of Geography for her PhD on “seasonal rainfall forecasting in West and East Africa” in 2002, she obtained post-doctoral funding from the French Spatial Agency to study the impacts of rainfall variability on vegetation greenness in the Sahel, using remote sensing data. In 2004, she moved to the Climate Research Center where she has a permanent research position. She worked on rainfall variability and its impacts on vegetation greenness in South Africa from 2008-2009 at the invitation of the Department of Oceanography at the University of Cape Town (UCT). Collaborating with colleagues from the Department of Oceanography and the Climate System Analysis Group at UCT, she pointed out an impact of the El Niño / La Niña Southern Oscillation (ENSO/LNSO) on the winter rainfall region. As a SAEON-sponsored guest to the 2011 Fynbos Forum held in Still Bay from 31 May to 3 June, she presented these results to the Fynbos Forum community. Nathalie has recently submitted bilateral (France – South Africa) and trilateral (France – Germany – South Africa) research projects with colleagues from the Plant Conservation Unit, the Department of Oceanography, the Climate System Analysis Group (UCT) and the Department of Botany, Ecology and Environment (Hamburg). Both these projects focus on the impact of climate variability on vegetation and fire in the recent past and the near future in the winter rainfall region of South Africa. |
- kc_data:
- a:8:{i:0;s:0:"";s:4:"mode";s:0:"";s:3:"css";s:0:"";s:9:"max_width";s:0:"";s:7:"classes";s:0:"";s:9:"thumbnail";s:0:"";s:9:"collapsed";s:0:"";s:9:"optimized";s:0:"";}
- kc_raw_content:
Les collaborations entre le CRC et les laboratoires sud-africains d'océanographie, de sciences du climat et d'écologie, basés à Cape Town, sont à l'honneur dans la Newsletter de Juin du South African Environmental Observation Network.

When El Niño and La Niña events modulate rainfall and vegetation greenness in the winter rainfall region of South Africa
Source: http://www.saeon.ac.za/enewsletter/archives/2011/june2011/doc07/
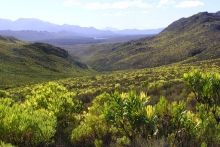 Little is known about the impact of El Niño / La Niña on the winter rainfall region located at the southwestern tip of Africa. Yet this region holds two of the world's biodiversity hotspots - the Fynbos (pictured) and the Succulent Karoo.
 Dr Nathalie Philippon is an international scientist sponsored by SAEON's Fynbos Node to foster cooperation with local scientists.
While anthropogenic and natural climate change and variability are much discussed, the impact of the El Niño / La Niña Southern Oscillation (ENSO/LNSO) on climate in the winter rainfall region of South Africa has only recently been discovered. This phenomenon appears to have become important for the southwestern part of South Africa's climate only in the last few decades.
Dr Nathalie Philippon, Junior Researcher from the Climate Research Center (CRC), University of Burgundy, Dijon, France describes the phenomenon:
Whereas the impact of El Niño / La Niña Southern Oscillation on the rainfall and vegetation greenness of South Africa's summer rainfall region is largely documented and still regularly investigated, little is known about its impact on the winter rainfall region located at the southwestern tip of the country. Yet this region holds two of the world's biodiversity hotspots - the Fynbos and the Succulent Karoo, the second largest city of the country, and is a net exporter of high quality agricultural products (apples, table grapes, oranges, wines ... cultivated under irrigated conditions mainly).
The relationship between ENSO and South Africa’s winter rainfall has been analysed using a daily rainfall database of 682 rain gauges (Lynch 1999) documenting the period 1950-1999. Figure 1 shows the 21-year moving correlations between the Niño3.4 index and the March, April, May (MAM), May, June, July (MJJ) and July, August, September (JAS) rainfall amount over the region (all rain gauges average).
The Niño3.4 index documents the sea surface temperature evolution over the equatorial Pacific (5°S-5°N/), and thus the ENSO/LNSO phenomenon. Interestingly, the MJJ seasonal rainfall amount shows a positive correlation with the Niño3.4 index that has become significant since the mid 1970's. Such a decadal variability in the teleconnection with ENSO is not specific to the region as it is observed for the summer rainfall in Southern and Western Africa as well.
Over the period 1979-1999, about 36% of the MJJ rainfall amount variance is explained by ENSO, and when the region records ~130mm in MJJ on average, this amount drops to ~90mm during LNSO years and rises to ~170mm during ENSO years. At the rain gauge scale, most of the stations record a 10-30% increase in rainfall during ENSO years, whereas during LNSO years it is mainly the stations north of 32°S that record a decrease of rainfall of ~40%.
To understand where the ENSO signal in the MJJ rainfall amounts come from, changes in the wet spells properties (length, frequency and intensity) have been assessed. Figures 2 and 3 present the variation (% of the normal) in the number of wet spells and their intensity for each rain gauge during ENSO and LNSO years. High MJJ rainfall amounts recorded during ENSO years are mainly the result of more frequent wet spells, north of 32°S in particular (Figure 2), while low MJJ rainfall amounts during LNSO years can be attributed first to wet spells bringing less rainfall (Figure 3).
The atmospheric dynamics fields associated with the wet spells feature lower pressure and northwesterly wind anomalies in the troposphere over the region during ENSO years and higher pressure and southerly wind anomalies during LNSO years. This suggests that rain-bearing systems are deeper and larger in extent, and located further north during ENSO events. During LNSO event they are thinner and smaller in extent and located further south.
Finally, Figure 4 presents the correlation between the Niño3.4 index and the Normalized Difference Vegetation Index (NDVI) field over the period 1982-2008 for the months from July to September. NDVI is a remote sensed measure of the vegetation photosynthetic activity and greenness inferred from the reflectance differences in the red and infra-red channels. Here NDVI data come from the NOAA-AVHRR database with a 8 km spatial resolution.
Given the high sensitivity of vegetation greenness to rainfall over the region, ENSO years, which are associated with higher than normal rainfall amounts in MJJ are logically associated with a higher than normal vegetation greenness as denoted by the positive correlations. The largest ENSO signal in vegetation greenness is observed in August, the peak of the vegetative season. However it is interesting to note that the ENSO signal emerges as soon as July in the regions north of 32°S (Namaqualand) and south of 34°S (Garden Route, Overberg).
Given the good predictability of the ENSO/LNSO events several months in advance, ENSO forecasts could be a tool for the management of water resources as well as fire throughout the region. Indeed, by modulating through the rainfall, the soil moisture and fuel load we can expect ENSO/LNSO events to play to some extent on fire frequency and intensity.
Figure 1: 21-year moving window correlations between Niño3.4 and the rainfall amount (average of the stations / grid-points) on the period 1950-2005 from Lynch (1950-1999, line) then GPCC (2000-2005, dots) database for the three trimesters MAM, MJJ and JAS. Niño3.4 and rainfall are considered synchronously. The black circles denote values significant at the 95% level according to Ebisuzaki random phase test. The x-axis provides the central year of the 21-year period.Figure 2: Mean variation (in percentage of the normal) of the number of wet spells during ENSO (left) and LNSO (right) years.Figure 3: Mean variation in the intensity of the wet spells (as a percentage of the normal) during ENSO (left) and LNSO (right) years.Figure 4: Correlation maps between July, August and September NDVI and the Niño3.4 index for the previous trimester. Shades of green and yellow respectively denote positive and negative connotations (enhanced greenness during ENSO years and reduced greennesss during LNSO yeards). Only the pixels in their vegetative season are considered.Dr Nathalie Philippon was awarded a travel grant by the SAEON Fynbos Node to foster cooperation between Fynbos researchers and international scientists. She was nominated by Professor Timm Hoffman of the Plant Conservation Unit, University of Cape Town.
Nathalie is a Junior Researcher from the Climate Research Center (CRC), University of Burgundy, Dijon, France. With a background in Geography and Climatology, her research focus is on rainfall variability and predictability in Africa.
Awarded 1st prize by the French National Committee of Geography for her PhD on “seasonal rainfall forecasting in West and East Africa” in 2002, she obtained post-doctoral funding from the French Spatial Agency to study the impacts of rainfall variability on vegetation greenness in the Sahel, using remote sensing data.
In 2004, she moved to the Climate Research Center where she has a permanent research position. She worked on rainfall variability and its impacts on vegetation greenness in South Africa from 2008-2009 at the invitation of the Department of Oceanography at the University of Cape Town (UCT). Collaborating with colleagues from the Department of Oceanography and the Climate System Analysis Group at UCT, she pointed out an impact of the El Niño / La Niña Southern Oscillation (ENSO/LNSO) on the winter rainfall region.
As a SAEON-sponsored guest to the 2011 Fynbos Forum held in Still Bay from 31 May to 3 June, she presented these results to the Fynbos Forum community.
Nathalie has recently submitted bilateral (France – South Africa) and trilateral (France – Germany – South Africa) research projects with colleagues from the Plant Conservation Unit, the Department of Oceanography, the Climate System Analysis Group (UCT) and the Department of Botany, Ecology and Environment (Hamburg). Both these projects focus on the impact of climate variability on vegetation and fire in the recent past and the near future in the winter rainfall region of South Africa.