l’article du mois – décembre 2011
 The influence of ENSO on winter rainfall in South Africa
par N Philippon, M Rouault, Y Richard et A Favre
International Journal of Climatology (2011), DOI: 10.1002/joc.3403.
Abstract:
Whereas the impact of ENSO on the African summer rainfall regions is largely documented and still regularly investigated, little is known about its impact on the winter rainfall regions located at the southwestern and northwestern tips of Africa. Yet, these regions are densely inhabited and are net exporters of high-quality agricultural products. Here we analyze the relationship between El Niño Southern Oscillation (ENSO) and South Africa austral winter rainfall using a 682 raingauges daily rainfall database documenting the period 1950–1999. The May, June and July (MJJ) seasonal rainfall amount shows a positive correlation with the Niño3.4 index that becomes significant since the so-called 1976/1977 climate regime shift. Wet spells properties (length, frequency and intensity) at the raingauge scale indicate that high (low) MJJ seasonal rainfall amounts recorded during El Niño (La Niña) events are the result of longer (shorter) wet spells in the Cape Town area and more (less) frequent wet spells north of 33°S. Wet spells with daily rainfall amounts ranging between 10 and 50 mm are also more (less) frequent. Atmospheric dynamics fields during wet spells feature lower (higher) pressure and northwesterly (southerly) wind anomalies in the troposphere over the region. This suggests that rain-bearing systems are deeper (thinner) and larger (smaller) in extent, and located farther north (south) during El Niño (La Niña) events. Copyright © 2011 Royal Meteorological Society
légende:
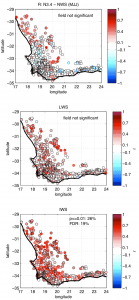
Correlation maps of the Niño3.4 index and the May-June-July Number (NWS), Length (LWS) and Intensity (IWS) of Wet Spells for the 682 stations. The red (blue) shades denote positive (negative) correlations. Circles with blue and red contours denote values significant at the 95% (90%) level according to Ebisuzaki random phase test. The percentage of significant correlations at α = 0.1 and the False Discovery Rate (FDR) are also provided when the field is significant.
- extrait:
- lien_externe:
- kc_data:
- a:8:{i:0;s:0:"";s:4:"mode";s:0:"";s:3:"css";s:0:"";s:9:"max_width";s:0:"";s:7:"classes";s:0:"";s:9:"thumbnail";s:0:"";s:9:"collapsed";s:0:"";s:9:"optimized";s:0:"";}
- kc_raw_content:
 The influence of ENSO on winter rainfall in South Africa
par N Philippon, M Rouault, Y Richard et A FavreInternational Journal of Climatology (2011), DOI: 10.1002/joc.3403.
Abstract:
Whereas the impact of ENSO on the African summer rainfall regions is largely documented and still regularly investigated, little is known about its impact on the winter rainfall regions located at the southwestern and northwestern tips of Africa. Yet, these regions are densely inhabited and are net exporters of high-quality agricultural products. Here we analyze the relationship between El Niño Southern Oscillation (ENSO) and South Africa austral winter rainfall using a 682 raingauges daily rainfall database documenting the period 1950–1999. The May, June and July (MJJ) seasonal rainfall amount shows a positive correlation with the Niño3.4 index that becomes significant since the so-called 1976/1977 climate regime shift. Wet spells properties (length, frequency and intensity) at the raingauge scale indicate that high (low) MJJ seasonal rainfall amounts recorded during El Niño (La Niña) events are the result of longer (shorter) wet spells in the Cape Town area and more (less) frequent wet spells north of 33°S. Wet spells with daily rainfall amounts ranging between 10 and 50 mm are also more (less) frequent. Atmospheric dynamics fields during wet spells feature lower (higher) pressure and northwesterly (southerly) wind anomalies in the troposphere over the region. This suggests that rain-bearing systems are deeper (thinner) and larger (smaller) in extent, and located farther north (south) during El Niño (La Niña) events. Copyright © 2011 Royal Meteorological Society
légende:
Correlation maps of the Niño3.4 index and the May-June-July Number (NWS), Length (LWS) and Intensity (IWS) of Wet Spells for the 682 stations. The red (blue) shades denote positive (negative) correlations. Circles with blue and red contours denote values significant at the 95% (90%) level according to Ebisuzaki random phase test. The percentage of significant correlations at α = 0.1 and the False Discovery Rate (FDR) are also provided when the field is significant.