l’article du mois – novembre 2011
 Climate adjustments over the African-Indian monsoon regions accompanying Mediterranean thermal variability,

Abstract
This study analyses the atmospheric and rainfall anomaly patterns in the African/Indian monsoon region concomitant of warm/cold anomalies confined in the Mediterranean sea in northern summer. It examines first the similarities and contrasts observed in longitudes, then discusses the results obtained regarding the normal in terms of climate impacts in the Sahelian belt. Statistical results show an opposite African/Indian relationship with stronger (weaker) African (Indian) tropical circulations occurring in warmer (colder) Mediterranean situations and favouring significant increases (decreases) in monsoon circulation, atmospheric moisture content and deep convection, mainly over the central-eastern Sahel. Model results show that several observed key-features can be reproduced through 23 warm/cold anomalies prescribed in the Mediterranean and that warm (cold) situations impact 24 more over the African (Indian) region. Warm experiments generate rainfall excesses in Sahel with a significant strengthening of southwesterlies. Cold experiments simulate rainfall deficits in Sahel, associated with an attenuation of southwesterlies in low levels and a zonal moisture transport shifted southward in mid-levels. Over India these simulations tend to generate rainfall surplus.
J. Geophys. Res, final acceptance 11 October 2011., doi:10.1029/2011JD016273, in press.
Legende de Image :
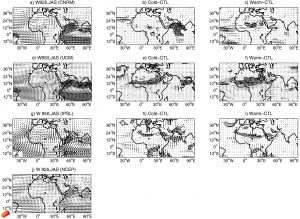
July-September wind fields in low levels (925 hPa) from CNRM (top), UCM (middle) and IPSL (bottom) experiments; (left) control runs with mean wind speeds above 10 m/s shaded. (middle) Cold minus control differences; (right) Warm minus control differences. Here the shadings refer to significant differences regarding a Student t-test at p=0.10. Panel j displays the reanalyzed wind field as reference.
- extrait:
- lien_externe:
- kc_data:
- a:8:{i:0;s:0:"";s:4:"mode";s:0:"";s:3:"css";s:0:"";s:9:"max_width";s:0:"";s:7:"classes";s:0:"";s:9:"thumbnail";s:0:"";s:9:"collapsed";s:0:"";s:9:"optimized";s:0:"";}
- kc_raw_content:
- Climate adjustments over the African-Indian monsoon regions accompanying Mediterranean thermal variability,par Fontaine B., Monerie P-A, Gaetani M. and Roucou P., 2011
accepté dans la revue Journal of Geophysical Research
AbstractThis study analyses the atmospheric and rainfall anomaly patterns in the African/Indian monsoon region concomitant of warm/cold anomalies confined in the Mediterranean sea in northern summer. It examines first the similarities and contrasts observed in longitudes, then discusses the results obtained regarding the normal in terms of climate impacts in the Sahelian belt. Statistical results show an opposite African/Indian relationship with stronger (weaker) African (Indian) tropical circulations occurring in warmer (colder) Mediterranean situations and favouring significant increases (decreases) in monsoon circulation, atmospheric moisture content and deep convection, mainly over the central-eastern Sahel. Model results show that several observed key-features can be reproduced through 23 warm/cold anomalies prescribed in the Mediterranean and that warm (cold) situations impact 24 more over the African (Indian) region. Warm experiments generate rainfall excesses in Sahel with a significant strengthening of southwesterlies. Cold experiments simulate rainfall deficits in Sahel, associated with an attenuation of southwesterlies in low levels and a zonal moisture transport shifted southward in mid-levels. Over India these simulations tend to generate rainfall surplus.
J. Geophys. Res, final acceptance 11 October 2011., doi:10.1029/2011JD016273, in press.
Legende de Image :
July-September wind fields in low levels (925 hPa) from CNRM (top), UCM (middle) and IPSL (bottom) experiments; (left) control runs with mean wind speeds above 10 m/s shaded. (middle) Cold minus control differences; (right) Warm minus control differences. Here the shadings refer to significant differences regarding a Student t-test at p=0.10. Panel j displays the reanalyzed wind field as reference.